Today in math we learnt how to solve linear programming problems. What we did today kind of had to do with what we learnt in yesterdays class.
Tuesday, November 23, 2010
Thursday, November 18, 2010
November 16th
Wednesday, November 17, 2010
November 17th
Law Of Cosines: Cosine Law
When to Use it?
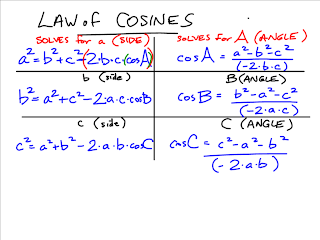
The above chart shows how to use cosin
e law to solv
e for
different things: (IE) the box on the top left side formula solves for a(side), the one below it for b(side) and the one below that for c(side). Across the table is the corresponding formulas for angles A, B, and C.

Scenario 1 (of 2) triangle shows that a (side) = 13, c (side) = 20) and B (angle) = 103(degrees) and are looking to find b (side).
Scenario 2 (of 2) shows finding the angle A
Similar triangles – they have the same shapes but different lengths(or distances)
Summary : Use the law of cosines if you have Two Sides and the Included Angle, OR All Three Sides.
"The inverse cosine of the cosine is the angle itself."
Monday, November 15, 2010
November 15th, 2010
For those of you who were not here today we have a substitute teacher. Mr.Max has left us some instructions or STUFF to do.
1. The AM is set for us to do practices
2. Some people such as myself got to do there AM Wiki help thing to do. It needs to be done for tomorrow.
3. We got to google and make notes on two definitions( Confidence Iinterval and Margin of Error)
I thought it would be nice of me to post the definitions for you courtesy of Wikipedia.
1. The AM is set for us to do practices
2. Some people such as myself got to do there AM Wiki help thing to do. It needs to be done for tomorrow.
3. We got to google and make notes on two definitions( Confidence Iinterval and Margin of Error)
I thought it would be nice of me to post the definitions for you courtesy of Wikipedia.
Confidence interval
From Wikipedia, the free encyclopedia
In statistics, a confidence interval (CI) is a particular kind of interval estimate of a population parameter and is used to indicate the reliability of an estimate. It is an interval that frequently includes the parameter of interest, if the experiment is repeated. How frequently the interval contains the parameter is determined by the confidence level or confidence coefficient. Confidence intervals are used in frequentist statistics; the equivalent in Bayesian statistics is the credible interval.
Margin of error
From Wikipedia, the free encyclopedia
The margin of error is a statistic expressing the amount of random sampling error in a survey's results. The larger the margin of error, the less faith one should have that the poll's reported results are close to the "true" figures; that is, the figures for the whole population. Margin of error occurs whenever a population is incompletely sampled.
I would normally post my opinion on the definitions but I think I will save the good meaning full discussion for Mr.Max to tell.
Tuesday, November 9, 2010
November,9/2010


Today we finalized our objectives that each of us are responsible for, and the criteria was set on how we are going to be scored. Each of us has an objective to learn and perfect so that they can teach the class how to do that specific objective, by putting it on our new class wiki http://www.grade11appliedmath.wikispaces.com/. Tuesday first 9 objectives are due Tuesday November,16/2010
Monday, November 8, 2010
wiki is a user place uses can upload.
we are going to lean how to make a potluck website.
so it can be accessed from the internet any where.
three words that you need is edit and save and link.
click edit then the web changes to a text page you wright what you need then press save.
yes we have to do a objective!!
Wednesday, November 3, 2010
Stuff on group and ungrouped data
In the following picture below we did a little test or exercise on how to find the mean of grouped data. Any way here's the steps I used to find the mean of the grouped data.
1. Stat/ Enter
2.in the L1 data set put in the number of days of exercise per week
3.in the L2 data set put in number of people
4.Stat /Calc/1: var stat/ Enter
5. 2nd 1 / , / 2nd 2
The pic below explains group and ungrouped data.
As for the pic or clip below Mr.Max showed that the total of the second column is the N.For all of you who don't know what N is, N is how many pieces of data there are.
1. Stat/ Enter
2.in the L1 data set put in the number of days of exercise per week
3.in the L2 data set put in number of people
4.Stat /Calc/1: var stat/ Enter
5. 2nd 1 / , / 2nd 2
The pic below explains group and ungrouped data.
As for the pic or clip below Mr.Max showed that the total of the second column is the N.For all of you who don't know what N is, N is how many pieces of data there are.
Subscribe to:
Posts (Atom)


